The role that a lack of-, or weak productivity plays in the inflation-, Central Bank- and Money Supply equation is being ignored, and hugely under-valued.
We find ourselves in an era of slack productivity. Reduced productivity combined with the Covid-19 government funded programs have become a toxic mix that adds to the current economic environment of high inflation amid (in order of driver):
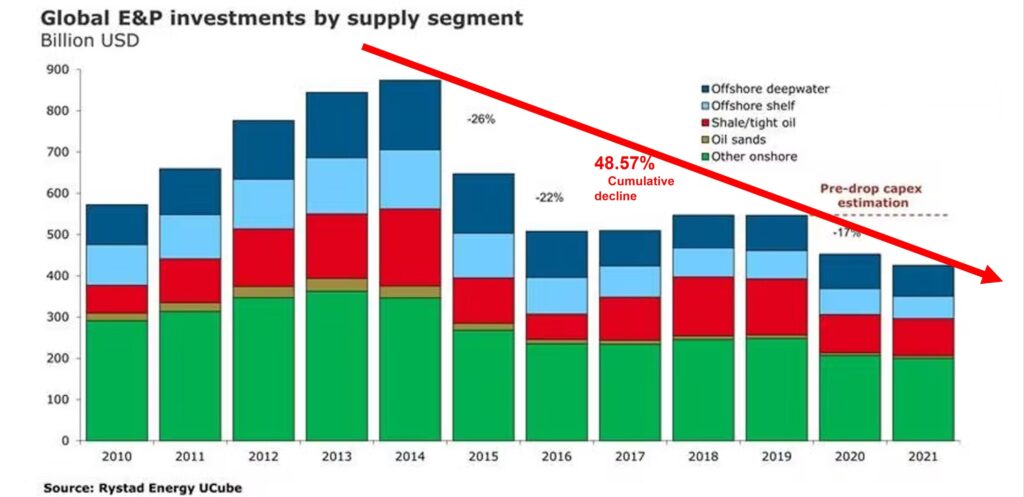
Weak climate change policy reducing investment in oil and gas since 2015;
Rise in commodity prices since April 2020 amid aggressive growth in demand for commodities required to produce RE component parts (lithium for batteries) against a shortage of critical minerals (or under developed critical minerals mining cited by the International Energy Agency in 2021 research papers);
Rise in oil prices driven by the aforementioned points amid large imbalances between oil demand and real oil supply.
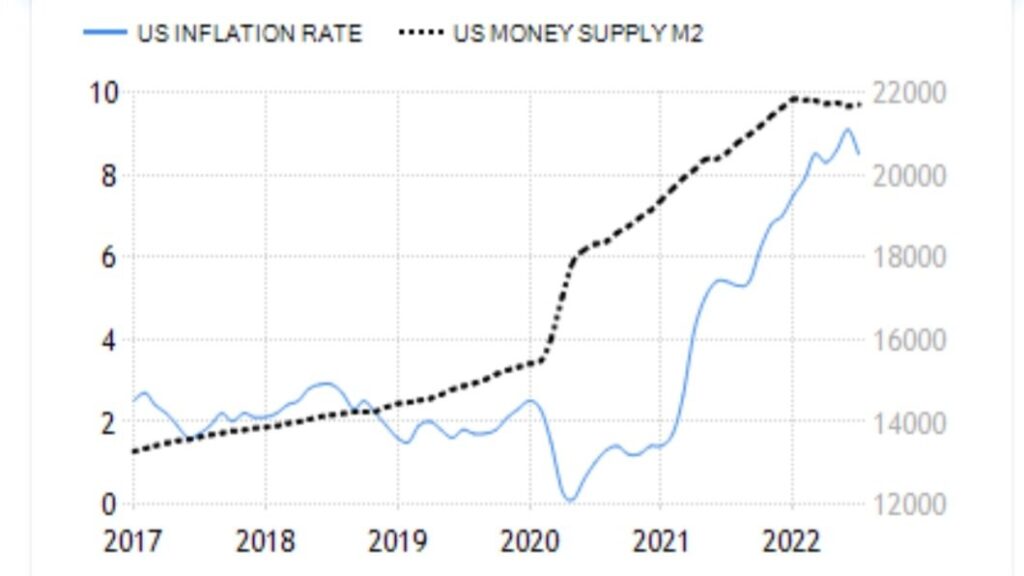
Source: Trading Economics
Sharp rise in inflation and money supply (which Central Banks deny, yet numbers don’t lie) stemming from the rise in oil & natural gas prices, and money printing by federal governments, all stemming from aforementioned;
“Global bond markets have suffered unprecedented losses since last year.”
It was evident then already, by mid-2021 that all the central bank talk, about inflation being transitory, was merely tactics to suppress rising bond yields.
Bond markets are predictors of what to expect going forward.
In early 2021 bond yields started to rise fueled by inflation concerns. Those concerns were valid because:
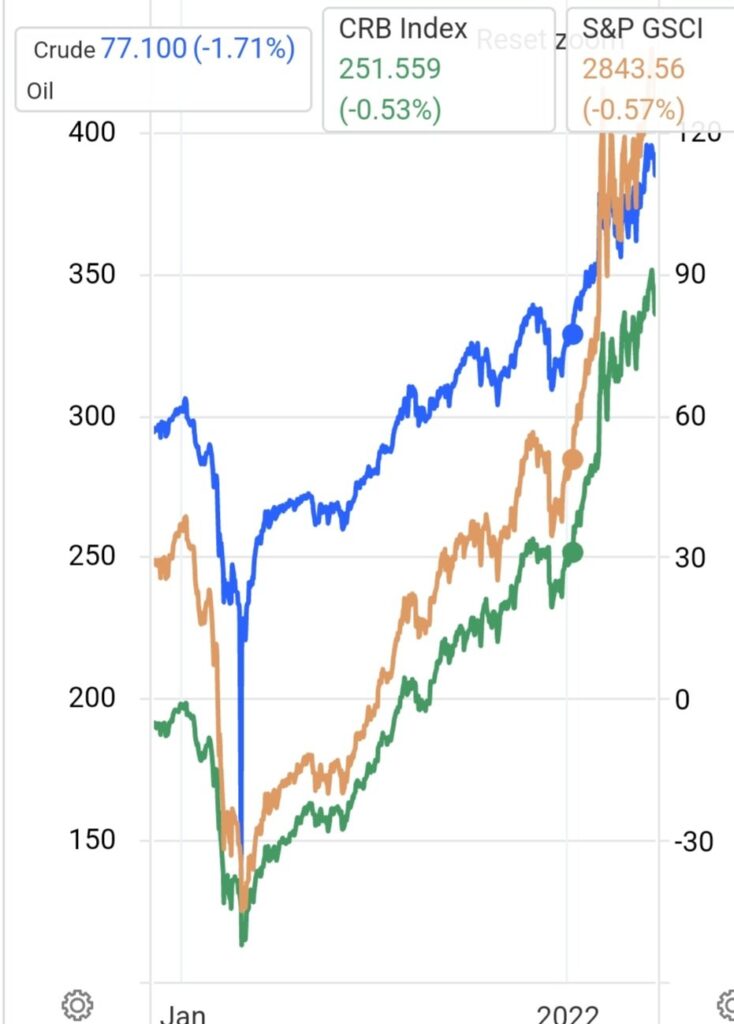
Commodity prices started rising during 2020. A new commodity supercycle started to form in April 2020;
Commodities’ rise is fueled by demand for core commodities used in renewable energy. This demand in return is fueled by policies backing the “green new deal” and climate change hysteria:
Demand for commodities drives the thirst for oil and gas. Commodities cannot be processed without the use of oil;
Increased demand for oil causes the oil price to rise. Oil and gas are major input costs in all goods and services being consumed, this transportation costs rises
Inflation is also fueled by massive govt spending on Covid-19 support programs. On top of that, the world is in a huge debt position considering all debt, both government and private sector debt, that exceeds ~500% of global GDP. Global government debt alone accounts for ~226% of global GDP.
Adding fuel to fire stemming from Quantitative Easying (QE) impacting money supply.
Looking back now, who in their right minds could give thought, weighing everything together, that inflation in 2021 was transitory? The central bank elites with impressive PhDs got it wrong. Are we on our way to stagflation? The probability for that is increasing.
O, and it’s ridiculous to refer to the inflation landscape as “Putin-flation”. It is not. World events of late merely added to an already unfolding inflation story.
Is the risk for Hyperinflation real? Or, is it merely a feeling combined with a “word” that comes to mind? I’ll give you that much, I grew up with- and have seen high levels of inflation, but not Hyperinflation. For some, the rise of inflation to above ~4% in Canada and the USA compared to inflation targets set by the Bank of Canada and the Federal Reserve, at around ~2%, is very overwhelming. Especially folks that have been born after the middle 1990s. The rise in inflation over the past few months translates into a ~100% increase in a very short space of time. It is indeed overwhelming.
To talk about Hyperinflation, we need to start observing economies moving towards month-over-month inflation of ~50% (some background on Hyperinflation). Given the rise in inflation since May of 2021, it’s not likely to happen anytime soon. Could we get there gradually? Perhaps, but not likely given the reasons cited that is driven by technology to keep rising costs down, and creative destruction. I’ll add a few extra points to that, to consider: The changing world from being a totally industrialized economy transforming into a services economy and the gig-economy, jobs that were in demand some 30 to 40-years ago are making way for technology-services and technology-serving related jobs.
Recently I needed to assist my younger son to make flight changes. We held on the phone line for a long long time to be connected with a booking agent. We decided to drive to the airport to go to the airline’s ticket booth. We arrived only to learn, that to effect flight changes, one has no other option other than to call; or if the ticket was booked with the ability to make changes, then make those changes online. It got me thinking, technology and the internet removed a services channel and replaced it with a different type of services channel. That is the kind of development that keeps costs down.
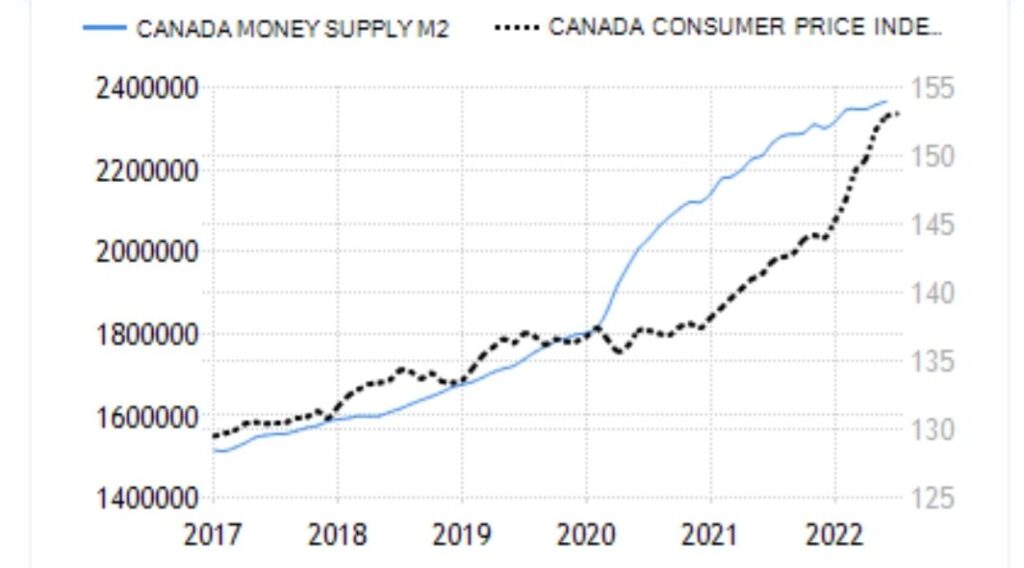
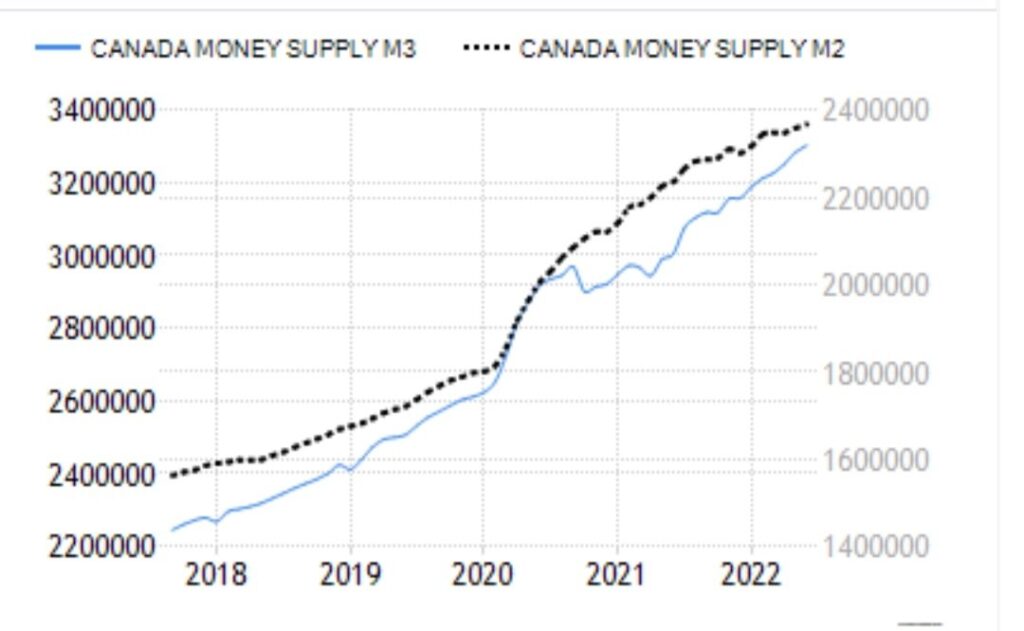
Let’s review Money supply as measured by M3 and M2. Other measures include M0. M2 is still used by central banks and economists but the emphasis on measuring money supply from different levels was modified over the years evolving from M0, M1 to M2, M3 and now MZ.
Investopedia defines the various Money Supply measures as:
“M0: Physical paper and coin currency in circulation, plus bank reserves held by the central bank also known as the monetary base M1: All of M0, plus traveler’s checks and demand deposits. M2: All of M1, money market shares, and savings deposits. M3 is a measure of the money supply that includes M2 as well as large-time deposits, institutional money market funds, short-term repurchase agreements (repo), and larger liquid assets. M3 is traditionally used by economists to estimate the entire money supply within an economy, and used by governments to direct policy and control inflation over medium and long-term periods. As a measure of money supply, M3 has largely been replaced by Money Zero Maturity (MZM). MZM, which represents all money that is readily available, is a measure of the liquid money supply within an economy. It includes money as cash in hand or money in a checking account, for example.“
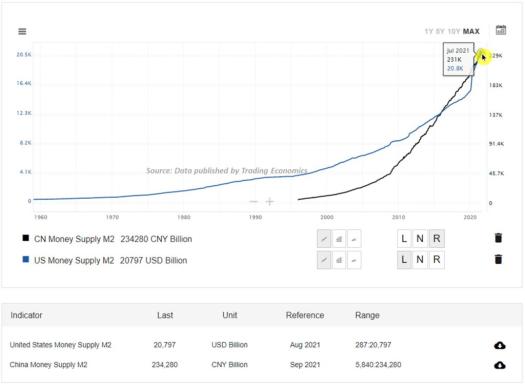
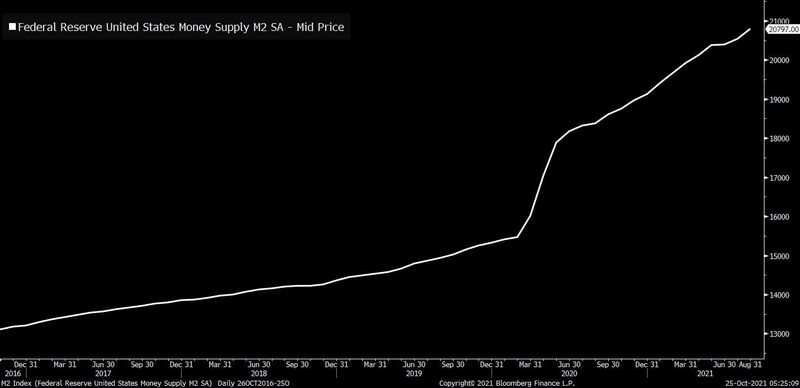
M2 Money supply for the USA and China reflecting the start of the Covid19 Pandemic:
M2 supply for the USA and China as of July 2021:
M2 Money supply has grown approx. 13.79% in ~18-months in the US and ~32.32% in China over the same period.
To get a clearer picture of the potential risks attached to Hyperinflation long-term long-range economic data is required to plot money supply against inflation trends to make more meaningful assumptions. A good proxy would be the use of the data as it pertains to the USA and China given that they compromise the bulk of the global economic output.
The growth percentages will have an effect on inflation for some time.,as they represent steep growth numbers over a short period of time. Safe to say that transitory inflation arguments, which I have been writing a lot about, do not hold water.
Since 2008, Monetary Policy Management and how it intersects with the economy changed a lot with the introduction of Quantitative Easing (QE) and the advancement of Modern Monetary Theory as the two are connected.
the introduction of new money into the money supply by a central bank”
QE has come modern-day money supply instruments at the wholesale capital market level. It involves the Central Bank purchasing government bonds from investors and banks to exchange the bonds for cash. It has expanded to practices of purchasing bonds other than government bonds. It is another method of injecting liquid cash into the financial system to stem the risk of liquidity risks. QE does not show up directly in the Money Supply. However, as it works its way through to the cash part of the Money Supply, it eventually does get recorded in money supply numbers. One would want to consider what QE looked like before Covid19 and where it is currently.
This would mean as the bond-buying continues the fair value on the central bank’s balance sheet appreciates. What happens when bond yields rise in reaction to concerns about inflation? The fair value of these bonds do down. as long as previously booked unrealized fair value gains and unrealized fair value losses, on a cumulative basis cancels out, or the economic stimulus ignites new economic growth, the risks of huge net-realized losses are lower. But what if we hit stagflation? Or persistent inflation at higher levels?
One would need to go back to the 1970s and derive how effective policy of the past can be combined with “modern-day money printing” to tame the inflation beast.
In the USA, the situation is not much better. In 2020 and 2021 combined the total amount spent on asset purchases in QE amounts to ~$4 trillion and the deficits combined for both years amounts to approx. $5.9 trillion.
It is very evident that Covid19 stimulus spending drove and is still driving deficit spending, thus giving meaning to “a consequence of government ineptitude and fiscal irresponsibility“. The proof in the pudding lies in how fast the QE can be reeled in as a break for likely high inflation? Time will tell I believe.
“Over the weekend, Twitter CEO Jack Dorsey said that hyperinflation is happening and that it’s going to change everything. Of course, nobody really knows what he meant or why he said it. One guess is that he’s long Bitcoin and it’s a good thing to tweet for pumping his bags. Who knows. Also tech types seem to be obsessed with the dollar and monetary policy these days for reasons that aren’t clear. Obviously the U.S. is seeing inflation these days that’s been higher than in the past, but it’s hardly hyper. But then someone will point out this chart of the so-called money supply (or some variant) as their trump card, and show that yes, there really is hyperinflation happening already.
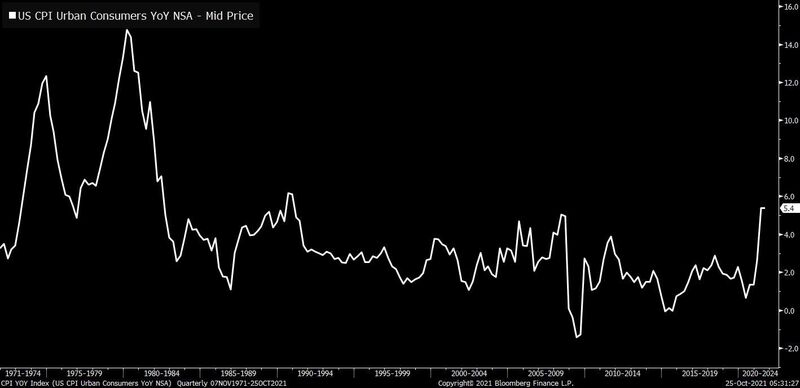
Fans of Austrian economics, in particular, are fond of this definition of inflation, that it’s not about the price of goods, per se, but the volume of dollars. But anytime I see a chart purporting to show an amount of dollars, my thought is always the same “who cares?”. The only reason we should care about any of this stuff is if prices are rapidly getting more expensive. If suddenly there were a huge increase in dollars everywhere, but prices didn’t move much, it wouldn’t matter. If the price of bread went nuts, it would be very bad. So a chart of the money supply tells us nothing that the inflation chart itself doesn’t. And yes, there’s no denying that inflation itself has been elevated relative to recent history, but again it’s not hyper, and really it’s not that wild if you zoom out even just a little.
The year-on-year change in headline CPI remains nowhere close to what we saw in the 1970s, and there were even times throughout the 80s where the numbers were higher. Speaking of the 70s,
, we spoke with Dan Alpert, a managing partner at Westwood Capital, and the author of a new paper that attempts to debunk the idea that a 70s-style inflationary spiral is coming anytime soon. As he sees it, quantitative ideas about money (such as the one above) have been debunked, and there remains plenty of actual capacity in the economy (domestically and abroad). All the bottlenecks and sources of pressure are in the moving of goods, he says, rather than their actual production.”
“Deflationary forces will overcome the supply-chain induced price pressures buffeting the world economy, Ark Investment Management LLC founder Cathie Wood said in a tweet after a Jack Dorsey post on hyperinflation. “Three sources of deflation will overcome the supply chain-induced inflation that is wreaking havoc on the global economy,” Wood said in a thread Monday. She was replying to an Oct. 23 post from Twitter Inc. chief executive Dorsey proclaiming hyperinflation “is going to change everything” and is “happening.”
The three sources of deflation Wood flagged are:
The impact of technological advances like artificial intelligence.
Creative destruction from disruptive innovation pushes down the price of obsolete goods.
Cyclical factors due to the pandemic whereby firms ramped up orders to meet reviving demand and will eventually be left with excess supply and unwinding prices after the holiday season.
Enduring supply-chain snarls are stoking inflation expectations and shaking up markets. Higher Treasury yields have led to questions about whether valuations for the kind of technology investments Wood is identified with are too stretched. The flagship Ark Innovation ETF is down 25% from a February peak.”
Inflation Hits 4.4% in Canada, Deepening Central Bank Challenge
Eugene Van Den Berg, Oct 2021
As I have predicted earlier in 2021, inflation is going to be with us for some time.
From the article:
“That’s the highest reading since February 2003, exceeding consensus expectations of 4.3%. Higher food, shelter, and transport prices were the main contributors. The hot inflation readings of the last six months are deepening a communications challenge for Governor Tiff Macklem, who maintains the spike in consumer-price gains will be short-lived. The data also comes as traders in the overnight swaps market bet increasingly against the Bank of Canada’s guidance that policymakers won’t raise interest rates until the second half of next year. Traders are pricing in at least three interest-rate hikes in Canada by the end of 2022, which would bring the policy rate to 1% from the current 0.25%.”
Raising rates from the current level of 0.25% to 1% in approx. one year from now will do very little to tame inflation.
Inflation patterns of the 1970s are evidently combined with the onset of a commodity supercycle I have been writing about regularly since earlier in 2021. A shortage of energy drives this commodity supercycle, demand for Renewable Energy (RE) core commodities to manufacture RE parts (industrial processes uses oil), and on top of that, deficit spending and high levels of debt.
Without productivity improvement, which in Canada has been weak for decades, the inflation spiral will subsist for a longer time. The risk for stagflation is also becoming more to the fore.